


Read full case studyClose study
HAGEN CASE STUDY Wood products
Company-wide transformation
An enduring competitive advantage achieved through the rigorous application of the Hagen Methods, business-wide.
36% more throughput in the pilot
At a glance
The financial crisis of 2007 and subsequent housing market collapse affected many U.S. businesses, especially those linked to construction. Boise Cascade, a leading supplier of wood products and building materials, was one of them. The company experienced a significant drop in volume and profitability due to the housing crisis, leading executives to look even more closely for ways to streamline business processes. Hagen & Company Inc. was selected to help Boise Cascade address manufacturing performance and costs.
Hagen & Company’s approach is focused on providing the client team with the tools, skills and environment necessary to achieve breakthrough performance.
- Control Factor Analysis® (CFA®): A structured approach for solving business and technical problems
- True Opportunity®: Patented software; the world’s first dollar-based OEE reporting system that provides real-time reporting and financial valuation of all OEE metrics, lost time, and lost raw material in any process
These two unique Hagen tools are woven into the way Boise Cascade runs its manufacturing plants. The program streamlines all of the activities done in the name of improvement.
After a highly successful pilot program, Boise Cascade determined that it found the right solution for its business: Hagen & Company. Starting in 2008, Hagen helped the company put in place all the systems, behaviors, and cultural changes needed to truly bring about a business- wide culture transformation—resulting in increased productivity, decreased costs, and higher levels of teamwork and cooperation across the Boise Cascade portfolio.
“Hagen is the secret sauce that drives change. You are the masters at starting the process. You helped create enough momentum, cultural shift and scale that we were able to run with it.” —Tom Corrick, Chief Executive Officer, Boise Cascade Company
The client
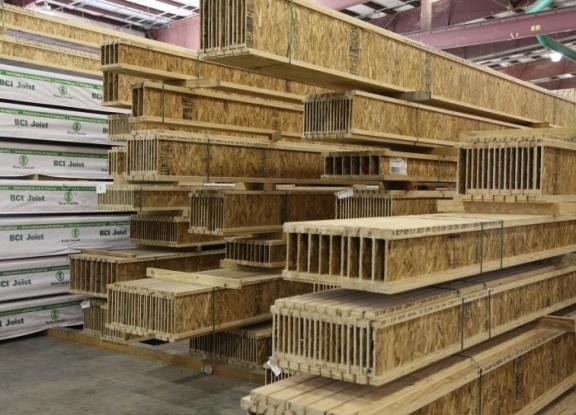
Boise Cascade Company is one of the largest producers of plywood and engineered wood products in North America and a leading U.S. wholesale distributor of building products. The Idaho-based company manufactures plywood, engineered wood products, lumber, and particleboard, and distributes a broad line of building materials, including the products manufactured by the company’s Engineered Wood Products (EWP) Division.
The challenge
Boise Cascade calls it the Boise Improvement Cycle (BIC) to become Best in Class: It is the company’s mission to “strive for perfection” by being the safest, best-quality, lowest-cost producer in the wood products industry. Boise Cascade exploits the tools and techniques of BIC to continually seek improvement in all areas of the business.
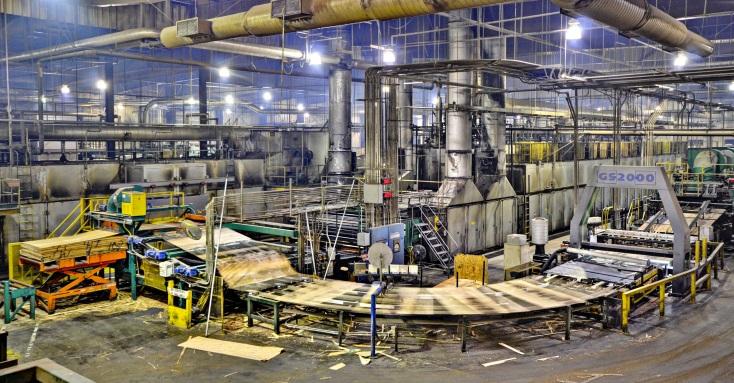
In 2008, in the midst of the economic crisis and housing collapse, Boise Cascade sought ways to streamline its business processes. The company began with one of its veneer mills that was experiencing efficiency problems. The mill was underperforming compared to other veneer mills in the industry.
Boise Cascade had a simple goal: increase the output per labor hour of the asset to exceed the level of the other mills. To do this, the company turned to three companies for a solution, including a pilot program to showcase each vendor’s proof of concept.
The first company was a recognized leader in the wood products industry that specialized in optimizing the complex computer programming operating lathe lines. These lines peel, clip out defects, cut to size, grade, and stack the veneer from an 8’ log, or “block” every 4 or 5 seconds. So there is a lot going on! This vendor achieved a 2% increase in throughput by optimizing the programming setup of the line to the current understanding of world class.
The second company invited to participate in a pilot program was the OEM (original equipment manufacturer). This vendor recommended an extensive capital upgrades program in order to bring the line up to the state-of-the-art, with an accompanying analysis showing all the benefits that would encourage Boise Cascade to purchase more of their equipment! However, capital was scarce and there were other pressing needs in the Boise Cascade business.
The third vendor option was Hagen & Company. Boise Cascade had come across Hagen at a conference. This approach was initially perceived as a risk since Hagen had not previously worked in the wood products industry in North America. They were seen as a long shot, and definitely perceived as the option with the lowest potential for success.
The solution
Starting with a small team from the veneer mill—including mechanical, electrical, planning, quality assurance, leadership, and operational resources—Hagen & Company trained Boise Cascade members in its CFA® (Control Factor Analysis) methodology, a proprietary problem- solving approach that previous clients have described as a “new way of thinking.”
The throughput of the line was 36% higher than the historical average, which the regional controller calculated to be an improvement worth $1.8 million. The success of the pilot program was enough to garner the attention of Tom Corrick, at the time, Senior Vice President of the EWP Division. Tom asked his team to bring him up to date: Was Hagen’s solution real? Was it sustainable?
Tom visited the mill to see the methodology in action and asked for a presentation from the team that delivered the improvement. Months earlier he had initiated a five-year plan for the company to become best in class; he just hadn’t worked out the how for his plan. However, after witnessing the veneer mill team’s enthusiasm and commitment to the Hagen methodology, as well as their plans to institute a system to make the learned skills and behaviors routine, Tom realized he had been shown the how.
Still, questions remained. The region that afforded the most opportunity for success was not the region where the veneer mill was located. Rather, it was the Southern Region consisting of two large plywood mills and the largest EWP mill in the world. Tom wondered, “What is it worth if I take this to the entire EWP business?” And so, he asked Hagen to perform an assessment on the Southern Region. The initial analysis indicated a total of $52 million per year of total profit opportunity; Hagen believed an initial target of $20 million per year was reasonable in this one region alone.
Results across the business
Boise Cascade and Hagen & Company have since worked together at more than a dozen plants using their CFA® methodology and True Opportunity® software. There have also been many additional benefits of integrating the Hagen process into Boise Cascade.

“In 2008 we had an ongoing quality issue,” says Tom. “This issue was restricting our ability to increase the efficiency of one of our critical EWP plants, and we believed it would become unmanageable if we pushed the rates. The Hagen process helped us solve that problem so we could increase our throughput. Now, we have the best reputation for quality product in the industry bar none. You can count the number of quality concerns we receive in a year on one hand. Additionally, the rate of the saw mill downstream has doubled— without capital!”
What has Boise Cascade been able to achieve with the help of Hagen & Company? Since the Hagen initiative began, the following list details just a few representative examples within a single plant. Improvement results like these, delivered without capital expenditure, are routine across the Boise Cascade business:
- At the same time as the average price of raw materials to the mill increased by 15% overall material costs decreased by 5%, representing a savings of $8 million per year.
- In a saw mill, where labor is 75% of conversion costs and the hourly rate is up 12%, the annual cost of running the work center is down $1 million.
- 16% output per hour improvement on the largest LVL press in the world in five weeks, resulting in over $1 million is productivity savings.
- 100% output per hour improvement in a multi-arbor rip sawing process.
- Elimination of the company’s biggest quality concern.
How did they do it?
Hagen & Co. engaged the Boise Cascade leadership with an exercise during the early stages of the program: Review the current reports and systems and ask, “If we could fix one thing, what should it be?” The top ten managers from the Southern Region responded with seven different answers.

After the kick-off workshop, the leaders agreed the quality problem was the major issue, agreeing that it had the double whammy effect of restricting the throughput of the hot press along with reduced credibility with the customer base.
With the major issue identified, the next critical step was to determine whether the leadership of the Southern Region was willing and ready to lead the effort. The opportunity to improve was reviewed in detail, and the Hagen method was shared to allow people to lead from a position of knowledge. Through better understanding of the financial opportunity, current performance and the existing barriers to improvement, the leadership team developed the necessary understanding of the systematic and behavioral change required of their teams. A plan of action was put in place.
When Hagen presented their assessment of the possible improvements, the Southern Region management team was shocked at the size of the potential opportunity. There was vigorous debate about whether these numbers were real and whether or not the savings could actually be realized. At one point the entire effort was almost cancelled because the numbers were judged to be naïve and unrealistic, and because of the perception that making such a commitment would lead to trouble.
However, any initial doubt soon passed when the focus changed to the plants with the largest opportunities and results started to come in. Hagen resources were deployed in partnership with Boise Cascade resources to train and coach the plant teams in tackling the most important operational issues facing the business. All work was completed by Boise Cascade people using the Hagen methodology. The staff worked in teams to learn the methods and then deliver real results in areas where their efforts had been frustrated in the past.
“When you deliver a result better than you thought possible using a manageable set of tools, you tend to reach into that toolbox repeatedly, building confidence, skill, and belief in yourself,” says Tom. “Once they had proven to themselves the techniques work, most were excited to design and build their own structured ways of improving their operations based on the Hagen system. All key decisions were made by Boise Cascade with advice, guidance and feedback from the Hagen team. Together, we have created a Boise system, the Boise Improvement Cycle (BIC), built by Boise people, in use by Boise people, at all levels, every day.”
A new narrative
Hagen & Company’s patented True Opportunity® application was installed to provide the data to drive improvement. Now, Boise Cascade managers know at all times which problem is having the biggest impact on the business’ profits within their area of responsibility — whether it is a one-off that happened yesterday or an endemic issue. In the early days, many of the issues identified were not even seen as problems; rather, they were seen as constraints, and as such, they were not on anyone’s action list. Now, with a track record of breaking through many ‘constraints’, it’s rare to hear someone say “it can’t be done”, and if that is heard, others are ready to challenge. True Opportunity® provides managers with accurate real-time data showing the real financial impact and a clear order of priority, allowing them to review this prioritization rolled up at any level, from one work center or product to the entire business. “It means everyone is on the same page, all the time,” says Tom. “There is no longer debate about opinions around what should be worked on. The teams are free to concentrate on the facts about what needs to be done.”
The stories of what had been achieved in the Southern Region became the new narrative of the company, and the other regions wanted in on the program. A corporate group staffed by well- respected leaders and experienced industry experts was created to manage the rollout and to provide the training. Hagen & Company provided Train-the-Trainer classes. The feedback from trainers showed their enthusiasm for the tools and desire to help their colleagues:
- “Limitless. There is no better way to learn about how our systems and equipment works.”
- “It’s a great tool which allows a team of people with varied backgrounds and levels of experience to dive into a problem and solve it to the root cause.”
- “I look forward to teaching and guiding others throughout the region on the principles and implementation of our Improvement Cycle.”
From pilot to company-wide transformation
What began as a pilot program has become a company-wide culture transformation for Boise Cascade. The company has instituted Hagen & Company’s methodology and software across its entire wood products portfolio — all because Tom saw the results from the initial test run at the veneer mill and wondered what the Hagen solution could do across his entire business. He had the courage to embrace change and pull the trigger on an enterprise-wide application that is ultimately changing the culture in all areas of the business.
“True Opportunity® is a scalable and industrial-hardened application,” Tom says. “It is a data- based process and a focused, results-driven methodology. It’s critical that we give our managers the tools necessary to succeed. What could be better than providing them with the financial impact of every waste within their area of responsibility? Everyone in Boise Cascade has a clear priority and the work they are doing connects directly to the bottom line.”
In addition to the systems improvements, Boise Cascade experienced a cultural shift as a result of implementing the Hagen methodology. Teamwork improved, and employees developed real and practical skills by working in the right way on the right things. Data was recorded, analyzed, and presented, and leadership teams changed the way problems were solved, as well as the collective view of what was possible. “We’re working towards a culture of not talking about opinions of what we have done or how smart we are, towards one where we are talking about the facts around what could be done and what the possibilities are.” says Tom.
The new industry experts
Boise Cascade says that although Hagen may be more adept at applying its methodology to any industry, Boise Cascade people are now the recognized experts in applying it in their industry. “We have to agree and congratulate them on their results,” says Ian Morrison, CEO of Hagen & Company. “They purchase the same capital as their competitors, but by breaking through the widely held sacred cows of their industry, they are able to gain a much higher ROI. Some of the behaviors and methods have migrated to the rest of the business by osmosis — people visit the plants and take away these best practices.”
For Boise Cascade, Hagen and Company has provided the means to continue the company’s mission of striving for perfection by offering the best quality, lowest cost products in the wood products industry.
Company profiles as published in 2015
Founded in 1957, Boise Cascade Company is one of the largest producers of plywood and engineered wood products in North America and a leading U.S. wholesale distributor of building products. The Idaho-based company, which is publicly traded on the New York Stock Exchange (NYSE: BCC), has more than 4,500 customers, including wholesalers, lumberyards, and retailers such as Home Depot.
Boise Cascade Company 1111 West Jefferson Street, Suite 300 Boise, ID 83702 208-384-6161 www.bc.com
The Hagen Method was founded in 1990 by Ian Thompson. Since then, Hagen has helped thousands of people in hundreds of plants and dozens of companies in almost all industries drive unprecedented rates of improvement. The Hagen Method allows people to quickly find the problems or constraints of most value in their business and then solve those issues or break through the constraints by putting in real, root cause solutions that endure. Hagen & Company embraces the best of Lean and Six Sigma, as well as the Hagen Method to help our clients unravel the code for building a pragmatic and sustainable system of improvement their people will embrace. Learn more about CFA® and True Opportunity® at www.hagenco.com
Hagen & Company Inc. 81 Washington Street, Suite 208 Salem, MA 01907 978-910-0491 www.hagenco.com

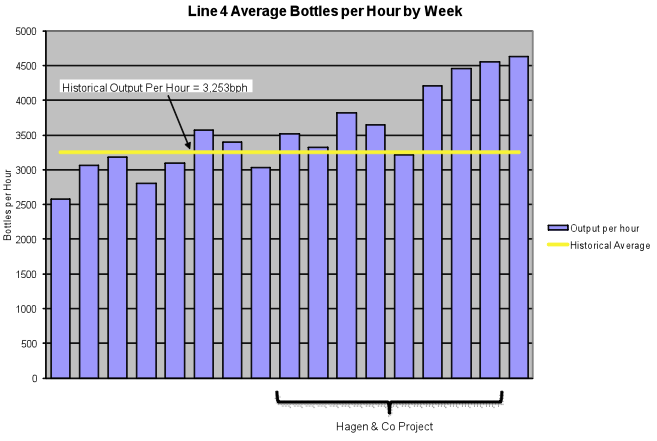 As a result of the project, line 4 production was increased by 42%, with productivity continuing to increase. Eight of the top 10 production days in the history of the line had occurred during the last 4 weeks of the project. This resulted in an annualized savings of over $440,000 in only 8 weeks, with no capital expenditure.
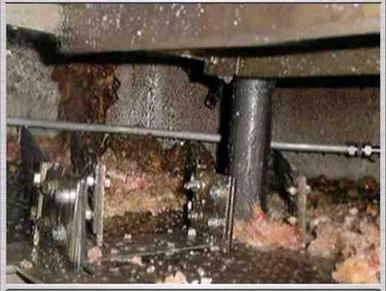
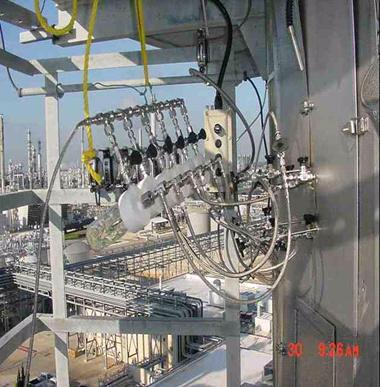 Once these critical factors had been identified there was significant interest in understanding them. The operators and engineers designed and installed a sample-taking apparatus to take samples at the newly identified points in the process. When the samples were captured it was clear that the reflux system was to blame. A redesign of how reflux was introduced back into the top of the column, costing $50,000, was fitted at the next shutdown. Once installed, polymerization was almost completely eradicated. Output increased by 20%.
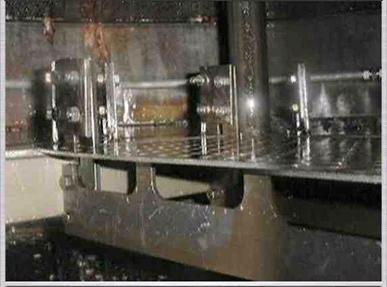 The new reflux design was fitted to the other plants and close to $80 million a year fell to the bottom line.
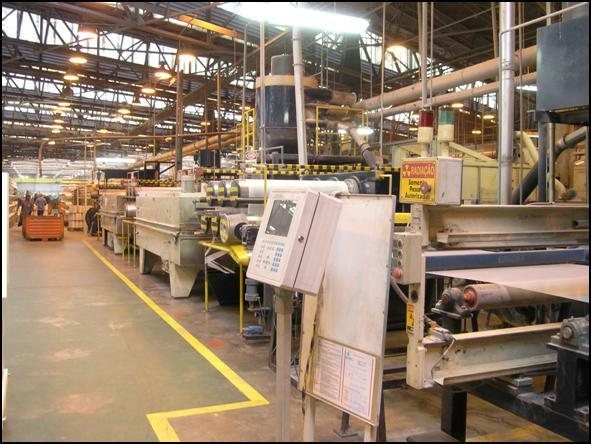
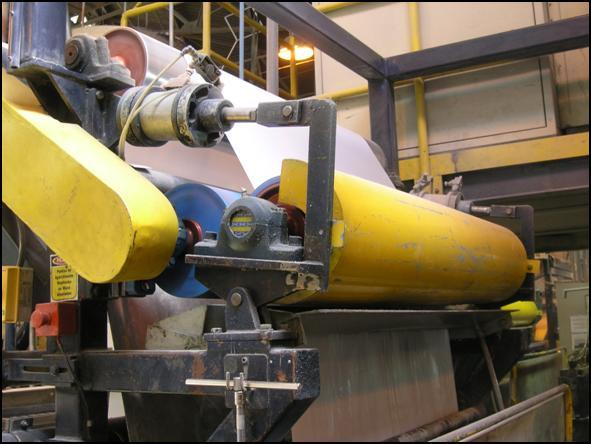 At the end of 2 months the throughput of the entire facility had increased by 14.5%, and there had been no need for capital expenditure. Over the following 4 weeks, the remaining identified actions were completed, and the increase in throughput stabilized at 17%. This additional capacity was worth US$2 million to them in extra annual profit.
 After a few days of training, the team set out onto the shop floor to analyze the performance of the line using Hagen’s Line Control Philosophy and problem-solving tool Control Factor Analysis® (CFA®). Data was collected and analyzed through a Lost Time Study, which allowed the team to identify all the sources of lost opportunity on the line (including downtime, waste, and lost time due to running the bottleneck slower than its max speed). The team also analyzed accumulation behaviors and capabilities, as well as the logic behind controlling the sub-process speeds.
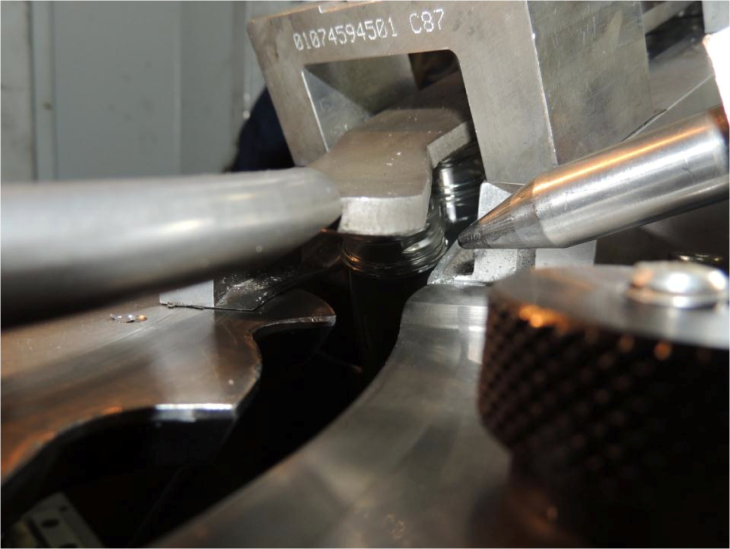 With a better understanding of how the team’s line was currently running, an action plan was developed to drive the changes needed for a more efficient line. Interestingly this action plan was completely different to what the plant team had been working on previously. From the Lost Time Study, the most significant source of lost time at the output bottleneck was a crash in the oven. The output bottleneck, the blow-molding machine, inflates plastic bottles from a heated plastic vial or preform. Preforms travel through an oven to be heated, but during an oven crash, the preform would melt onto one of the light bulbs in the oven and cause subsequent preforms to melt as well. With a build-up of melted preforms, the light bulbs begin to break and lead to a small fire. This problem had existed for years, however previous problem solving efforts had always failed.